Crash Report Output (Windows)
Overview
Choreonoid has a function that writes out the information needed to identify the cause of a crash when the application terminates abnormally. This function is currently available only on Windows.
When the function is enabled, the following two files are generated on a crash.
Crash report (.txt)
A text file that records the call stack of the position where the application crashed, the kind of the exception, and the list of the modules that were loaded. This file alone shows where in the program the crash occurred.
Dump file (.dmp)
A binary file that records the state of the process at the crash. It is opened with a debugger such as Visual Studio when a closer look is needed.
The function is intended for situations such as the following.
A crash that only reproduces on the computer of a user who has no development environment. The user sends the report and the developer investigates the cause
A crash at a site where an application based on Choreonoid has been delivered
When a crash occurs, the following notification dialog is shown to tell the user where the report file has been saved.
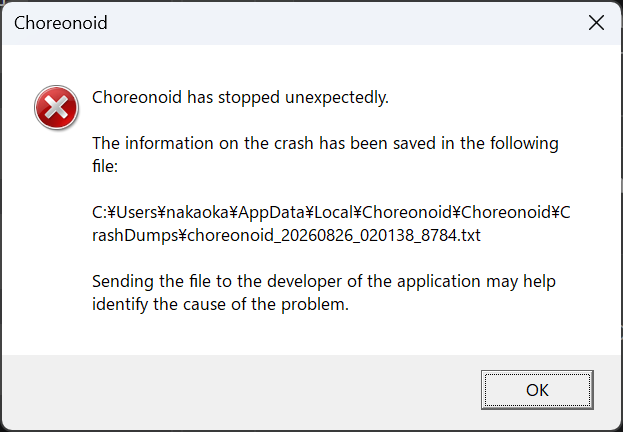
Without this function, a crash on Windows can terminate the application without showing anything, leaving the user with no idea of what happened. With the function enabled, the user is informed of the crash by the dialog, and it is clear which files should be sent to the developer.
Windows has a similar function, the local dump function of Windows Error Reporting (WER), but it requires editing the registry with administrator privileges and only produces a dump file. This function requires no administrator privileges and produces a text report directly.
If you are a user of Choreonoid and have encountered a crash, refer to the sections from Enabling the Function to Generated Files and send the generated files to the developer. Refer to Reading the Report if you want to check the contents of the report yourself. The sections from Getting Function Names and Line Numbers onward are mainly intended for the developers of Choreonoid itself and of applications based on Choreonoid.
Enabling the Function
The function is disabled by default. The report contains file paths and the list of the loaded modules, and the dump file contains the contents of the memory of the process, so such files are not left on a user’s computer unless the user intends it. While the function is disabled, neither the related library is loaded nor the output directory is created.
The function is enabled with environment variables set when Choreonoid is launched.
Environment variable |
Value |
Behavior |
|---|---|---|
CNOID_CRASH_DUMP |
Not set or empty |
Disabled (default) |
CNOID_CRASH_DUMP |
0 |
Disabled |
CNOID_CRASH_DUMP |
full |
Enabled, and the dump file contains the whole memory of the process |
CNOID_CRASH_DUMP |
Any other value (such as 1) |
Enabled |
CNOID_CRASH_DUMP_DIR |
Any path |
Changes the output directory |
An application based on Choreonoid (one built with the App class of Choreonoid) is enabled with the same environment variables. No code has to be added on the application side.
When you ask a user to enable the function, the most reliable way is to give them a batch file like the following, which sets the environment variable and then launches the application.
@echo off
set CNOID_CRASH_DUMP=1
start "" "C:\Program Files\Choreonoid\bin\choreonoid.exe"
Replace “C:\Program Files\Choreonoid\bin\choreonoid.exe” with the actual installation path.
Generated Files
Output Directory
The files are written to the following directory.
%LOCALAPPDATA%\<organization>\<application>\CrashDumps
<organization> and <application> are names determined by the application, and both are “Choreonoid” for Choreonoid itself. The output directory for Choreonoid itself is therefore as follows.
C:\Users\<user>\AppData\Local\Choreonoid\Choreonoid\CrashDumps
The output directory is created automatically. When CNOID_CRASH_DUMP_DIR is set, the files are written to that directory instead.
Since AppData is a hidden folder, the easiest way to open the directory in Explorer is to type
%LOCALAPPDATA%\Choreonoid\Choreonoid\CrashDumps
into the address bar. Each crash produces a pair of a report (.txt) and a dump file (.dmp) in this directory.
Old files are removed automatically, and the files of at most 10 crashes are kept.
Note
The output directory is on the AppData\Local side, not in %APPDATA% (AppData\Roaming) where the configuration files of Choreonoid are stored. A dump file is large and is a record of what happened on that particular computer, so it is kept out of the location that a roaming user profile synchronizes to other computers. This is the same level as the default location of the local dumps of WER (%LOCALAPPDATA%\CrashDumps).
File Names
The file names have the following format.
<executable name>_<date>_<time>_<process ID>.txt
<executable name>_<date>_<time>_<process ID>.dmp
For example:
choreonoid_20260826_021646_2428.txt
choreonoid_20260826_021646_2428.dmp
The report and the dump file of the same crash have the same base name.
File Sizes
The following are the file sizes measured for a crash during the startup of Choreonoid.
File |
Size |
|---|---|
Crash report (.txt) |
About 10 KB |
Dump file (default) |
About 240 KB |
Dump file (with CNOID_CRASH_DUMP=full) |
About 450 MB |
The report and the default dump file together are about 250 KB, which is small enough to be sent as an e-mail attachment. The dump file generated with full has to be sent through a file transfer service or the like.
Reading the Report
A crash report is a text file with contents like the following (the module list is truncated here). The report is always written in English regardless of the display language of Choreonoid.
Crash report of an application based on Choreonoid

Application     : Choreonoid
Choreonoid ver. : 2.6.0
Executable      : C:\Program Files\Choreonoid\bin\choreonoid.exe
Date            : 2026-08-26 02:16:46
Process ID      : 2428
Thread ID       : 22692
Reason          : Unhandled exception
Exception code  : 0xC0000005 (EXCEPTION_ACCESS_VIOLATION)
Exception addr  : 0x00007FFEE8DA6A4D
Faulting module : C:\Program Files\Choreonoid\bin\CnoidBase.dll
Fault offset    : 0x0000000000076A4D
Access type     : write to 0x0000000000000000
Dump file       : C:\Users\<user>\AppData\Local\Choreonoid\Choreonoid\CrashDumps\choreonoid_20260826_021646_2428.dmp
Dump type       : minidump

Call stack of the crashed thread (the most recent call first):

  00  CnoidBase.dll             + 0x00076A4D  cnoid::MainWindow::Impl::Impl + 0x9D  [MainWindow.cpp:149]
  01  CnoidBase.dll             + 0x00076F9A  cnoid::MainWindow::MainWindow + 0xAA  [MainWindow.cpp:138]
  02  CnoidBase.dll             + 0x000776AE  cnoid::MainWindow::initialize + 0x3E  [MainWindow.cpp:119]
  03  CnoidBase.dll             + 0x00035287  cnoid::App::Impl::initialize + 0xB77  [App.cpp:713]
  04  CnoidBase.dll             + 0x0002ECA2  cnoid::App::Impl::exec + 0x42  [App.cpp:881]
  05  choreonoid.exe            + 0x0000149E  main + 0x20E  [choreonoid.cpp:7]
  06  choreonoid.exe            + 0x000022FD  qtEntryPoint + 0x15D  [qtentrypoint_win.cpp:50]
  07  choreonoid.exe            + 0x0000171E  __scrt_common_main_seh + 0x106  [exe_common.inl:288]
  08  KERNEL32.DLL              + 0x0001259D  BaseThreadInitThunk + 0x1D  (*)
  09  ntdll.dll                 + 0x0005AF78  RtlUserThreadStart + 0x28  (*)

  The debug information (PDB file) of the modules of the frames without a
  source line is not available on this computer. A name marked with (*) is
  just the exported symbol nearest to the address and is often a function
  other than the one that actually contains it. The module name and the
  offset in it are always exact, and the developer can identify the exact
  position from them with the same binary and its debug information.

Loaded modules (100):

  base address        size      time stamp  file
  0x00007FF7AA300000  0x00011000  0x6A8DCA30  C:\Program Files\Choreonoid\bin\choreonoid.exe
  0x00007FFF9F5D0000  0x00218000  0xAC55DAA3  C:\WINDOWS\SYSTEM32\ntdll.dll
  0x00007FFF9DE80000  0x000C4000  0xE4CACA22  C:\WINDOWS\System32\KERNEL32.DLL
  ...

Please send this file to the developer of the application. The dump file
listed above is also useful to investigate the details of the problem.
This example was obtained by deliberately causing a crash for testing. The report consists of three parts: the summary of the crash, the call stack, and the module list. The following explains how to read each part.
Summary of the Crash
The beginning of the report records the summary of the crash with the following items.
Item |
Meaning |
|---|---|
Application |
Name of the application |
Choreonoid ver. |
Version of Choreonoid the application is based on |
Executable |
Path of the executable file |
Date |
Date and time of the crash |
Process ID / Thread ID |
Process ID / ID of the thread that crashed |
Reason |
Kind of the abnormal termination (see below) |
Exception code |
Exception code and its name (see below) |
Exception addr |
Address at which the exception occurred |
Faulting module |
Path of the module (DLL/EXE) in which the exception occurred |
Fault offset |
Offset of the address in that module |
Access type |
For an access violation, whether it was a read or a write, and the target address |
Dump file |
Path of the corresponding dump file |
Dump type |
minidump or full dump |
Faulting module and Fault offset have the same meaning as the “Faulting module name” and “Fault offset” recorded by Windows in the “Application Error” event (event ID 1000) shown in the Event Viewer. The same information is available from the report without opening the Event Viewer.
Reason takes one of the following values.
Value |
Meaning |
|---|---|
Unhandled exception |
An exception was not handled anywhere (the most common case) |
Abnormal termination by the abort function |
The abort function was called (for example, by a failed assertion) |
An exception that is not caught by any handler |
A C++ exception was not caught by any handler |
Call of a pure virtual function |
A pure virtual function was called |
An invalid parameter given to a runtime library function |
The runtime library detected an invalid argument |
The following exception codes are common.
Code |
Name |
Meaning |
|---|---|---|
0xC0000005 |
EXCEPTION_ACCESS_VIOLATION |
Access violation: reading or writing through an invalid pointer. The most common case |
0xC0000094 |
EXCEPTION_INT_DIVIDE_BY_ZERO |
Integer division by zero |
0xC00000FD |
EXCEPTION_STACK_OVERFLOW |
Stack overflow, for example by infinite recursion |
0xC0000374 |
STATUS_HEAP_CORRUPTION |
Corruption of the heap was detected |
0xE06D7363 |
C++ exception |
A C++ exception that was not handled |
Call Stack
The part following “Call stack of the crashed thread” records the call stack of the thread that crashed. Each line has the following format.
number module name + offset in the module function name + offset in the function [source file:line number]
The lines nearer the top are the more recent calls, and the line numbered 00 is the position where the crash occurred.
The module name and the offset in the module are always exact.
The function name and the line number are only shown when the debug information (PDB file) of the module is available on the computer.
A function name marked with (*) is the name of the nearest exported function preceding the address, which is shown because no PDB file was available. It is not necessarily the function that actually contains the address. In the example above, the Windows system libraries (KERNEL32.DLL and ntdll.dll) are such cases.
Only the thread that crashed is recorded. Analyze the dump file when the state of the other threads is needed.
Even without the debug information, the order of the frames and the module names with their offsets are exact, so the report always tells in which module and at which position the crash occurred. A developer who has the binaries and the debug information of the same build can identify the exact position from this information. See Getting Function Names and Line Numbers for how to prepare the debug information.
Module List
The part following “Loaded modules” lists the modules that were loaded at the crash, with their base addresses, sizes, time stamps, and file paths. This is useful for the following purposes.
Checking whether a third-party DLL has been injected into the process. Security software, screen overlays, and hooking utilities are sometimes the cause of a crash, and this list can be used to check them.
Identifying which build each module came from, using the time stamp and the size.
Getting Function Names and Line Numbers
The rest of this page is mainly intended for developers.
As described above, the order of the frames and the module names with their offsets are exact even without the debug information. The debug information is needed only for the function names and the line numbers.
On Windows, the debug information is stored in a “PDB file” separate from the executable file (EXE/DLL). To get the function names and the line numbers, the application has to be built with the debug information, and the PDB files have to be placed appropriately.
Building with Debug Information
A Release build with Visual C++ does not generate PDB files by default. To generate them, turn on the CMake option ENABLE_MSVC_DEBUG_INFO_FOR_RELEASE when building Choreonoid.
cmake -B build -G "Visual Studio 17 2022" -DENABLE_MSVC_DEBUG_INFO_FOR_RELEASE=ON
When using the CMake GUI tool, check this option, which is shown in the normal list of the options. See Building Optional Features for how to set options in CMake.
This option adds /Zi to the compiler options and /DEBUG /OPT:REF /OPT:ICF to the linker options. The optimization options are unchanged, so the generated machine code is identical and the runtime performance is not affected. Only the build time and the disk space for the PDB files (a little over 1 GB for Choreonoid itself) increase.
Note
A PDB (Program Database) file is the debug information file that the linker generates separately from the executable file. It holds the correspondence between function or variable names and addresses, the type information, and the table that maps an address to a source file and a line number. It does not contain the source code itself. While the debug information is included in the executable file by default on Linux, it is always a separate file on Windows. Enabling the debug information therefore hardly changes the size of the EXE/DLL files, and a build distributed without the PDB files is equivalent to a build without the debug information.
Placing the PDB Files
The generated PDB files are installed by cmake --install into the same directories as the corresponding EXE/DLL files (bin, lib\choreonoid-<version>, and bodyhandler and customizer under it). In the build directory, they are under bin\Release and lib\choreonoid-<version>\Release.
Note that third-party DLLs such as those of Qt and the Visual C++ runtime have no PDB files.
A PDB file is found automatically when the report is written if it is in the same directory as the corresponding EXE/DLL. The following two ways of operation are therefore possible.
Ship the PDB files with the application
The report then contains the function names and the line numbers directly, so only the report has to be sent. The size of the distribution increases (several hundred megabytes for Choreonoid itself).
Keep the PDB files on the developer side
The report always contains the exact module names, offsets, and time stamps, so the position can be identified by matching them against the PDB files of the same build. In this case, the PDB files of every release have to be archived reliably.
Correspondence between PDB Files and Binaries
A PDB file records a unique ID generated when the binary is linked, and the same ID is embedded in the corresponding binary. A PDB file whose ID does not match is not loaded. Note the following points.
The PDB files of a previous build cannot be used with rebuilt binaries.
A procedure of “first receive the report only, then rebuild with the PDB files” does not work. To get the function names and the line numbers, the crash has to be reproduced with binaries built with the debug information from the beginning.
This mechanism prevents wrong analysis results caused by mismatched PDB files.
Analyzing the Dump File
When the information in the report is not enough, for example when you want to check the state of the other threads or the contents of variables and objects, open the dump file with a debugger and analyze it. The following is the procedure with Visual Studio 2022.
Start Visual Studio.
Drag and drop the .dmp file onto the Visual Studio window. You can also open it from the menu with “File” - “Open” - “File”.
The “Minidump File Summary” page is shown. Check the exception code and the module list there.
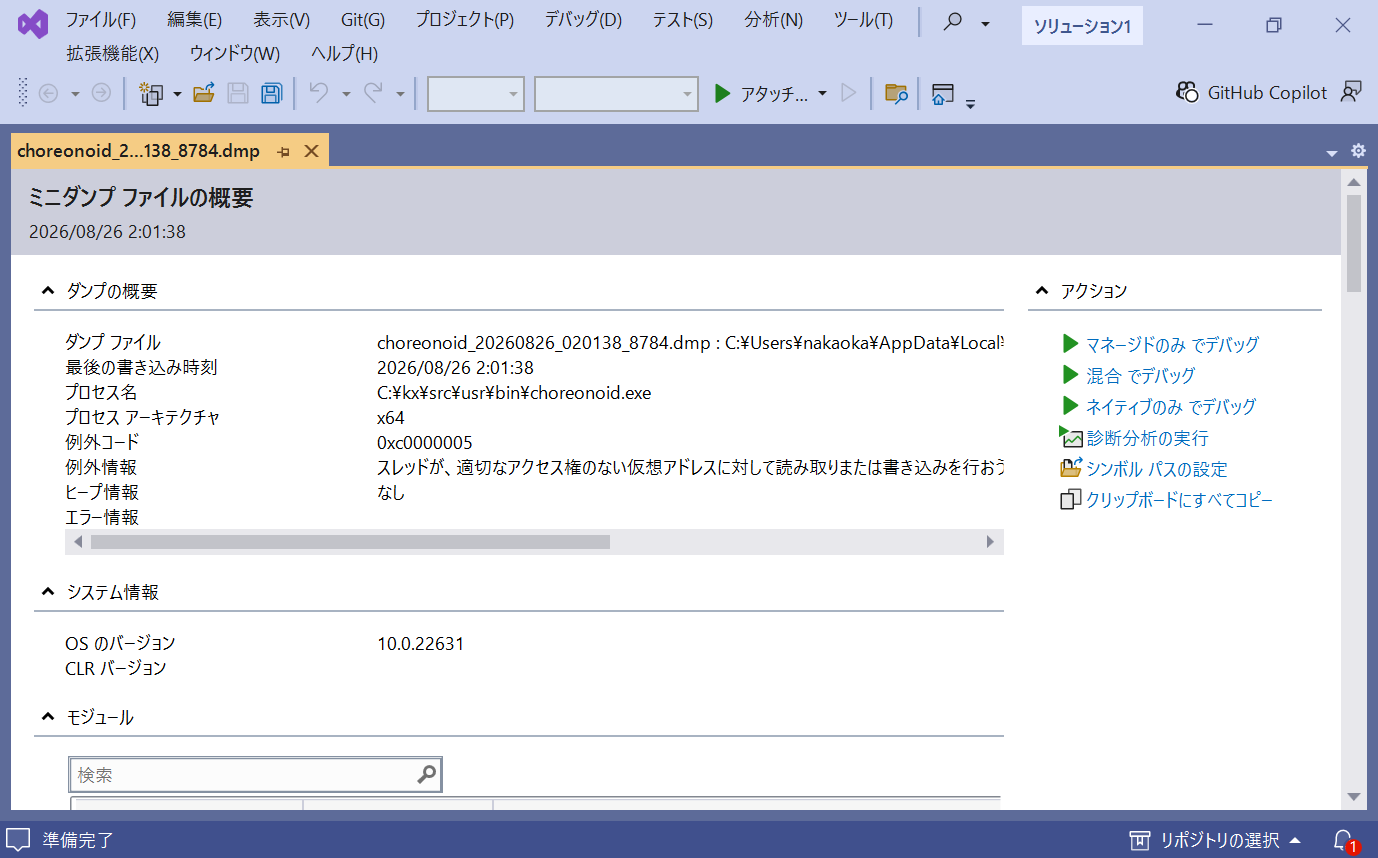
Click “Debug with Native Only” in the “Actions” on the right of the page.
Open “Debug” - “Windows” - “Call Stack” (Ctrl+Alt+C) from the menu to check the call stack. The function names and the line numbers are shown when the PDB files are available.
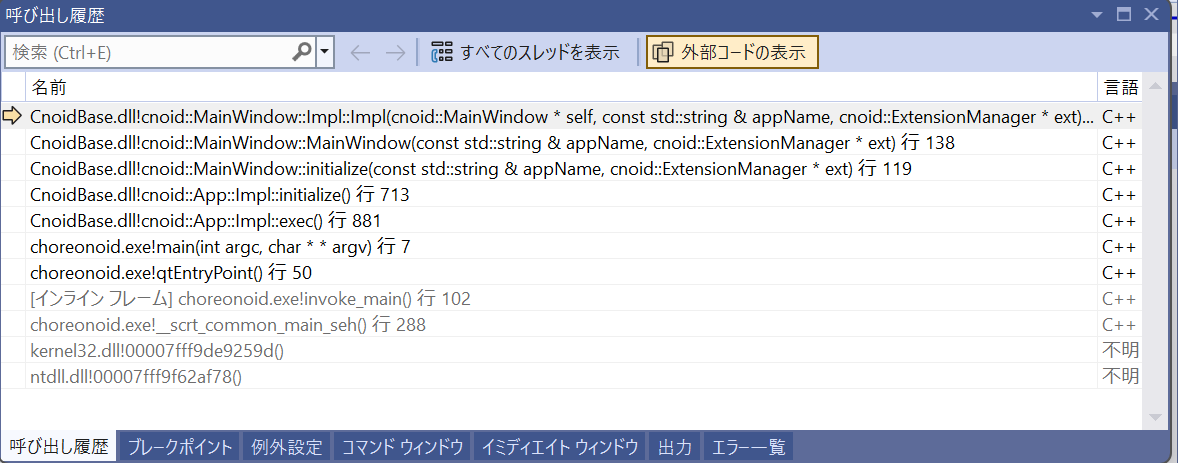
Open “Debug” - “Windows” - “Modules” (Ctrl+Alt+U) from the menu to check the modules that were loaded.
(The screenshots above were taken with the Japanese user interface of Visual Studio.)
If the symbols are not resolved and the function names are not shown, add the folder containing the PDB files as a symbol file location in “Tools” - “Options” - “Debugging” - “Symbols”. To show the function names of the Windows system libraries as well, enable “Microsoft Symbol Servers” in the same settings.
Note the following points when analyzing a dump file generated on another computer.
The default dump file (minidump) does not contain the code of the modules. The analysis therefore requires not only the PDB files but also the corresponding EXE/DLL files. The information used for unwinding the stack on x64 is stored in the binaries, so the call stack itself cannot be obtained correctly without them.
Visual Studio uses the symbol file locations to search for the binaries as well as the PDB files, so the dump can be analyzed by adding the folder containing the EXE/DLL and PDB files as a symbol file location. The directory layout of the computer where the dump was generated does not have to be reproduced.
Limitations and Notes
The function is available only on Windows. On the other platforms, setting the environment variables has no effect.
Only the thread that crashed is recorded in the call stack.
The report is written by the crashed process itself, so the resolution of the function names may fail when the heap is badly corrupted. The module names and the offsets are still written in that case. When the corruption of the heap has been detected (STATUS_HEAP_CORRUPTION), the resolution of the function names is not attempted at all.
Extra stack space is reserved for the main thread so that a stack overflow can also be reported, but the report may not be written for a stack overflow in a worker thread.
The report contains file paths and the module list, and the dump file contains the contents of the memory of the process. Check the contents before sending them to a third party.
The function does not interfere with Windows Error Reporting (WER). The Application Error event (ID 1000) is still recorded in the event log, and the local dump function of WER still generates its own dump when it is configured.
When the application is launched with the
--headless,--batch, or--non-interactiveoption, the notification dialog is not shown so that a modal dialog does not block an automated run. The same message is written to the standard error output in that case.The handling of crashes is set up at a very early stage of the startup. Since the message translation data has not been loaded at that point, the dialog for a crash that occurs immediately after the startup is shown in English.
Effect on Performance
Enabling the function adds no processing during normal execution. The mechanism is a handler that the operating system calls when the process crashes; there is no resident thread or periodic processing, and function calls and exception handling are not slowed down.
The only cost of enabling the function is the initialization at startup. The difference in the startup time is within the measurement noise, and the memory usage increases by about 0.2 MB because the debugging library dbghelp.dll is loaded. In addition, the usable stack of the main thread becomes 64 KB smaller, because that much is reserved for detecting a stack overflow.
On Linux
On Linux, similar information can be obtained with core files (core dumps), which are a standard mechanism of the OS. See How to Find the Location of a Crash Using Core Files for details. On Linux, the debug information is included in the executable files, so there is no need to prepare separate files such as PDB files.